Spatial Correlation by Anesthetic Condition
Mean activity-onset correlation C(r) against inter-pixel distance, nine conditions
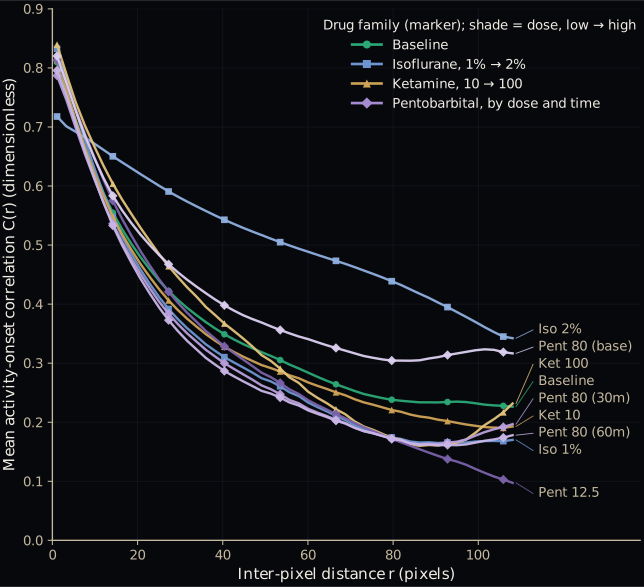
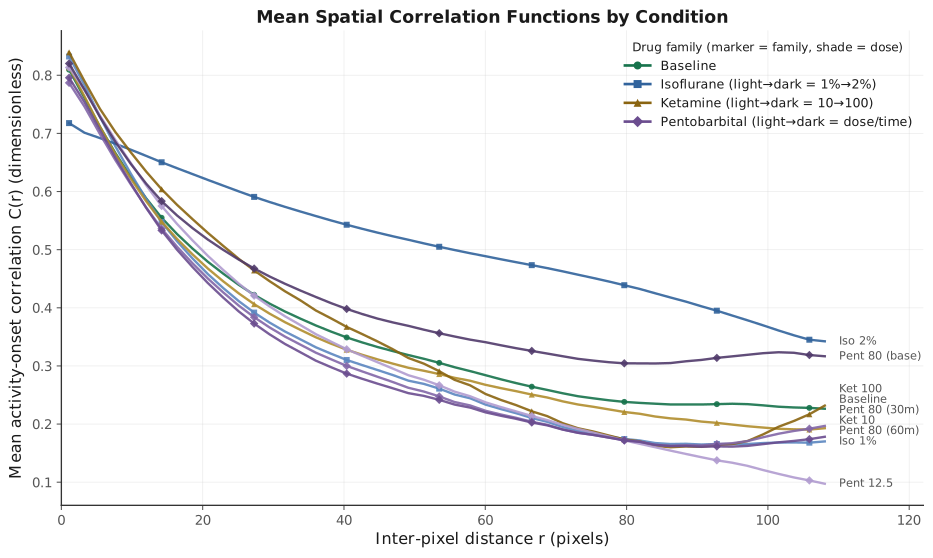
Nine curves, one per anesthetic condition, plot mean activity-onset correlation C(r) against inter-pixel distance from about 1 to 108 pixels; hue marks the drug family, shade the dose. The curves sit at different vertical levels (different correlation floors and amplitudes) while decaying over similar characteristic distances, the visual form of the null result that the correlation length does not vary across conditions.