Correlation Length Against Metabolic Rate
The spatial-domain null result
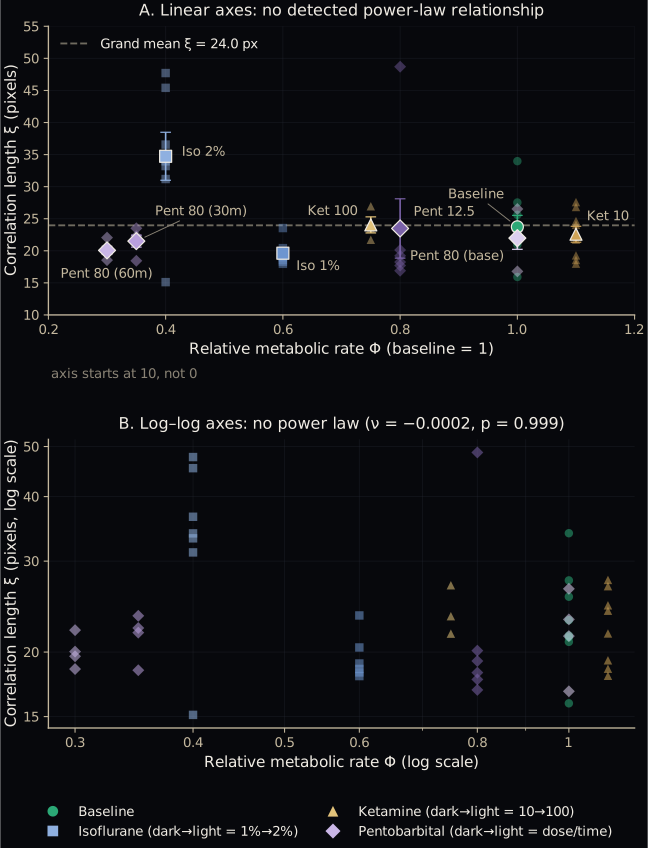
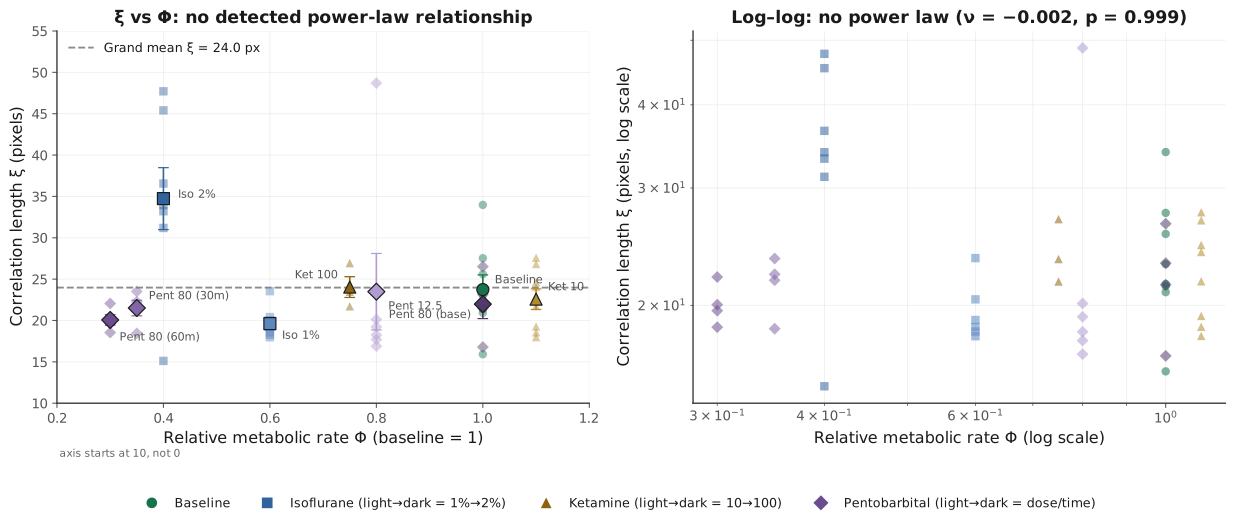
Fifty individual recordings (small markers) and nine condition means with standard-error bars (large edged markers) plot correlation length ξ against relative metabolic rate Φ, on linear axes above and log–log axes below. The condition means scatter around the grand mean of 24.0 pixels with no trend as Φ falls from 1.1 to 0.3, and the log–log cloud is flat (fitted exponent ν = −0.0002, p = 0.999); marker shape and hue encode drug family, shade encodes dose.