Susceptibility Against Metabolic Rate
Integrated excess correlation stays flat as metabolism falls
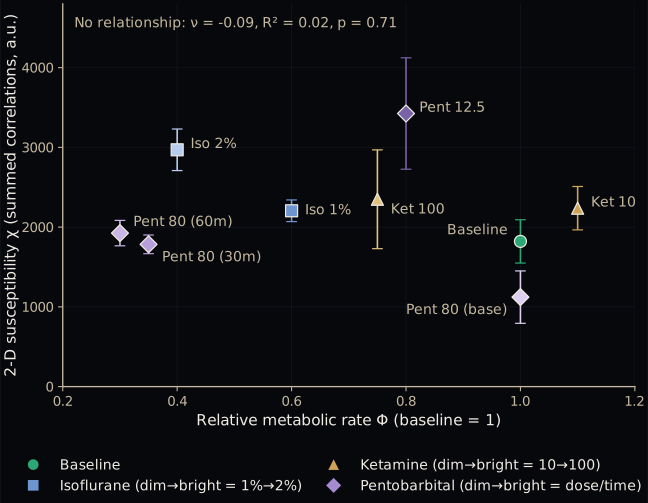
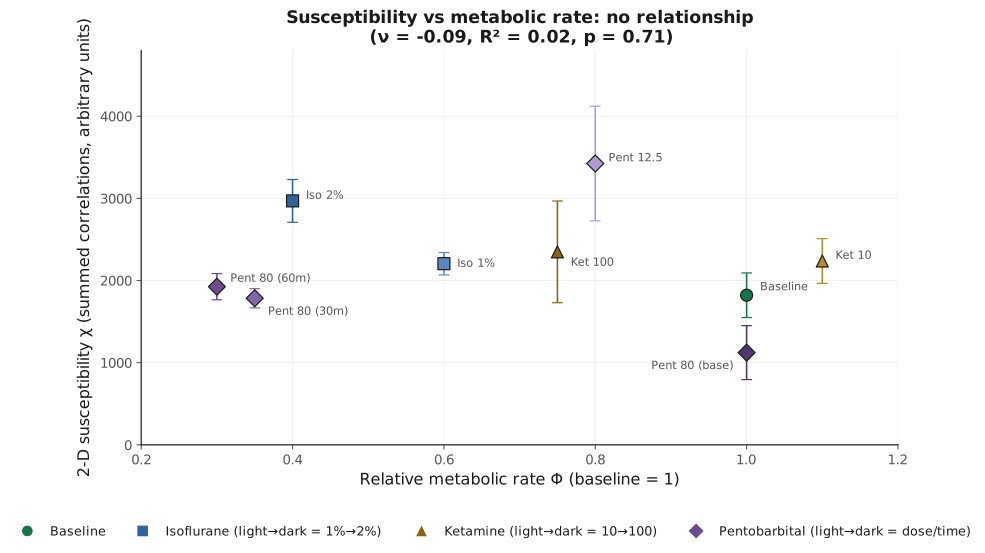
Two-dimensional susceptibility χ, the summed spatial correlation, is plotted against relative metabolic rate Φ for nine anesthetic condition means with standard-error bars. Values scatter between roughly 1100 and 3400 arbitrary units with no trend as Φ falls from 1.1 to 0.3; the fitted power-law exponent is ν = −0.09 with R² = 0.02 and p = 0.71.