

The Deeper Law
Preview edition · Updated 12 October 2026, 14:47 UTC
Does Steering Get Harder as Models Grow?
A sharper question remains: what happens to inference-time control as models grow larger? Inference-time control means steering a model’s behavior while it generates, leaving its weights untouched. The Control Scaling Frontier (CSF) programme began with a prediction that fitted activation steering (injecting a learned direction into the model’s internal state during generation) would weaken with scale. It paired that prediction with a possible explanation: post-training might lock refusal behavior in place firmly enough to absorb a rank-one perturbation (a push along a single direction), while prompt-level engagement might use added representational capacity more effectively. Those were hypotheses to test, rather than established mechanisms.
The programme tested this prediction on ten instruct models (models post-trained to follow instructions) from three architecture families, Qwen, Llama, and Gemma, ranging from 2 billion to 72 billion parameters. Two base models (the raw pretrained models, before any instruction post-training) at 7 billion and 72 billion parameters served as comparisons.1165
The intervention was activation steering: injecting a learned direction into the model’s residual stream (the running internal state that each transformer layer receives and updates during generation) at inference time. That direction was fit to the model’s own activations on adversarial prompts, separating the cases the model refused from the cases it complied with. AUROC (area under the receiver-operating-characteristic curve, a score from 0 to 1, with 0.5 indicating chance ranking and 1 indicating perfect rank separation) reports how cleanly the direction tells those two behavioral classes apart on the same prompts it was fit to. The score is therefore an in-sample measure of how legibly refusal and compliance sit in the activations; it says nothing about whether the model recognized an external push. The behavioral outcome was whether the model’s refusal rate actually changed under steering.
Near-Perfect Separation, Unreliable Translation
Across every model tested, AUROC remained at or above 0.96.
Behavioral movement was uneven and often weak.
To summarize how far behavior moved, the programme used a conversion index of its own devising. Zero means the refusal rate did not move. A value near one means the change in refusal happened to equal the gap defined below; it does not mean the steering delivered some amount of change that the AUROC had promised, because AUROC promises none.
The number is the change in refusal divided by the gap between the probe’s AUROC and the baseline refusal rate, an ad hoc denominator that combines two different observables. For example, a model with a 36% baseline refusal rate, an AUROC of 0.96, and a steered refusal rate of 42% has a conversion of (0.42 - 0.36) / (0.96 - 0.36) = 0.10. The denominator is a programme convention rather than a principled quantity, since it subtracts a rate from an area-under-curve score, two numbers that share the 0-to-1 interval without measuring the same thing. The index is descriptive within this programme. The corrected figures below show refusal rates and in-sample AUROC separately, avoiding a common headroom interpretation.
On that convention, conversion was 0.094 and 0.096 for Qwen instruct at 3 billion and 7 billion parameters, 0.000 at 14 billion and 32 billion, with the historical 0.179 at 72 billion based on the stored 43-percent keyword reading. Applying the keyword rule for spotting refusals, corrected so that curly and straight apostrophes in phrases like I can’t count alike (the apostrophe-normalized marker rule), to the retained treatment and the actual unsteered control gives 49 and 32 refusals in 100 matched cases, a 17-point difference. This is a recount of saved response excerpts, without a new behavioral run. Direction fitting and selection reused the baseline cases, so the difference awaits held-out confirmation. Gemma instruct converted at 0.128 (2 billion), 0.269 (9 billion), and 0.000 (27 billion). Llama changed from 0.732 at 8 billion to −0.429 at 70 billion, where steering destroyed coherent output entirely, producing empty strings and repetitive tokens rather than a valid behavioral measurement.
The Llama 70B result requires emphasis. The negative conversion is degenerate output, not resistance. The model did not refuse to be steered and maintain its prior behavior. The perturbation overwhelmed the generation process, producing gibberish. Describing this as “the model resists steering” would mischaracterize the mechanism. The model broke.
The relationship between scale and steering failure does not follow a smooth log-linear scaling law. A fitted line accounts for only 14% of the variation on this sample (R2 = 0.14), so it catches almost none of what the models actually did. Chapter 17e reports R2 = 0.395 for a narrower sample.1166 A logistic fit within Qwen reaches R2 = 0.995 only by compressing the series into a threshold-shaped curve that omits the 72 billion point, which rebounds to the highest conversion in that family. Gemma supplies three scale points, and Llama supplies two, with the larger Llama point invalidated by coherence failure. These data show architecture-specific variation and several low-conversion large-model conditions. They do not identify a universal size threshold.
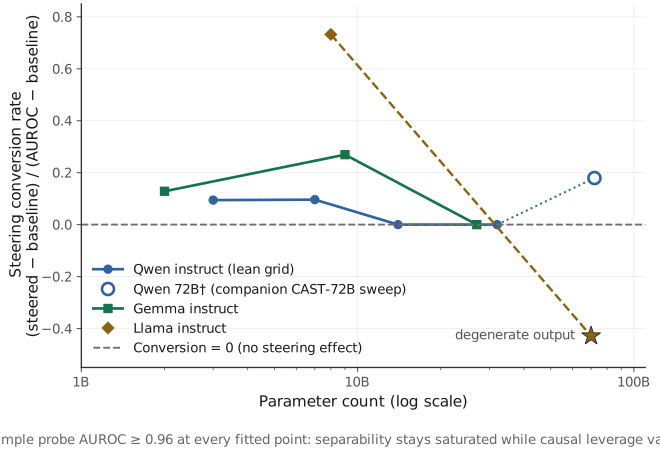
Figure 17b.1: Refusal rates and probe ranking shown separately. The upper panel compares baseline with best-steered refusal; the lower panel reports in-sample AUROC. The Qwen 72B companion point has 43 stored keyword refusals and 49 after apostrophe normalization, two label versions of the same 100 generations. The matched unsteered control has 32 refusals under the same normalized marker rule, a 17-point difference from the normalized steering result. Fitting and selection reused these cases. Llama 70B’s incoherent output supplies no valid behavioral rate. Companion sweeps remain distinct from the lean grid.
A perfect thermometer is not a thermostat. This is a gap between representational separability and causal leverage at the safety-intervention level. A fitted direction can recover the refusal-compliance partition almost perfectly on its own training prompts while activation editing along that direction produces little behavioral change. The result does not establish that the model recognized an external push. It establishes that a direction useful for reading behavior need not be a direction that controls behavior. Across the tested scale points, in-sample separability stays saturated while conversion varies by architecture, model size, and intervention outcome.
The 42% Band
If scale alone explained the failure, base models should fail identically. Under steering they nearly do: the 7B base gained five points against the 7B instruct model’s six. The difference appears under prompting.
Two prompt-level interventions ran alongside steering on these base models. Five-shot prompting puts five worked examples of appropriate refusal in front of the question. Re-prompting waits until the model has already given a harmful answer, then asks it to reconsider, and re-prompt success counts how often it withdraws.
Qwen 7B base: 19% baseline refusal, 24% under best steering (+5 percentage points), 54% with five-shot examples, 64% re-prompt success. Qwen 72B base: 28% baseline, 42% under best steering (+14 percentage points), 88% with five-shot examples, 30.6% re-prompt success. The larger base checkpoint shows more steering lift in this two-point comparison, and its five-shot response is the highest refusal rate in the programme. Two points do not establish a base-model scaling law, or show that instruction post-training is what separates base from instruct behavior.
Under best steering, the retained Qwen instruct rates are 42 percent at 3B, 42 at 7B, 42 at 14B, 36 at 32B, and the corrected 49 at 72B, a thirteen-percentage-point spread. The 72B point comes from a companion sweep; apostrophe normalization corrects its stored 43-percent keyword reading to 49 percent on the same retained generations. Four of the seven reported Qwen conditions, 72B base among them, sit at exactly 42 percent; the 7B base reaches 24. This descriptive repetition supplies no fixed-point mechanism, and the spread establishes no invariant ceiling.
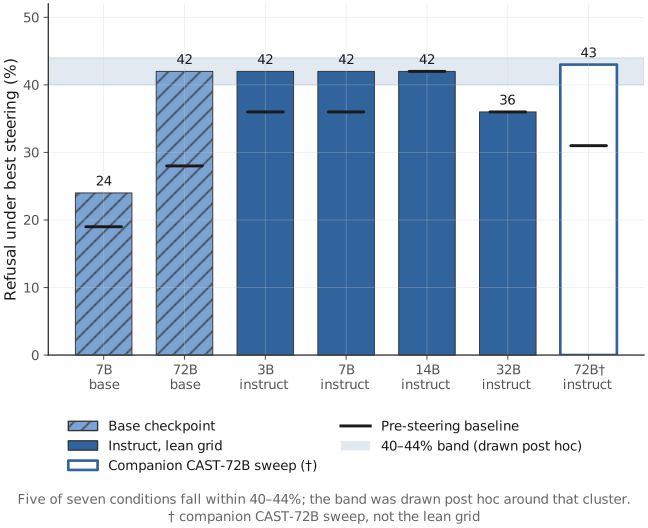
Figure 17b.2: Four reported Qwen conditions repeat 42-percent refusal. The shaded 40-to-44-percent cluster was chosen post hoc and establishes no ceiling. The open 72B bar uses stored labels (43 percent); its diamond uses apostrophe-normalized keyword labels (49 percent). The 72B tick is the actual unsteered control, 32/100 under the same normalized marker rule; the other ticks retain their reported baseline values. The spread and mixed protocols supply no invariant scaling law.
One candidate mechanism, inferred rather than measured, is that post-training distributes refusal-relevant behavior across structure that a single fitted direction cannot control. Refusal would then rest on many overlapping contributors rather than one: push along a single axis and you move one of them, while the others go on holding the behavior where it was. The CSF design did not measure redundancy, compare matched pre-training checkpoints, or test every inference-time intervention. The mechanism remains open.
Worked Examples and Second Chances Land Unevenly
The few-shot results depend strongly on model family and training regime.
On Qwen instruct, five-shot examples showing appropriate refusals reduced refusal rates at small scale (29% versus 36% baseline at 3 billion, 21% versus 36% at 7 billion). One possible interpretation is that the models treated the examples as task demonstrations; this was not measured directly. Five-shot was neutral or negative at larger Qwen instruct scales (42% at 14 billion, 30% versus a 36% baseline at 32 billion) and was not tested on Qwen 72B instruct.
On Qwen 72B base, five-shot examples lifted refusal from 28% to 88%: the highest rate in the programme, exceeding every instruction-tuned model tested. On Llama 70B, five-shot lifted refusal from 30% to 53%. On Gemma instruct, the effect was positive but modest (+6 to +10 percentage points across the scale range). These outcomes show that in-context examples can alter behavior strongly in some conditions. They do not identify whether the mechanism is reasoning, imitation, template matching, or another prompt-sensitive process.
The re-prompt pathway (asking the model to reconsider after an initial harmful response) tells a parallel story with caveats. Re-prompt success was 64% on Qwen 7B base and 41% on Llama 70B. On Qwen instruct models, it ranged from 0% to 7.8%. On Gemma instruct, from 0% to 14.6%. The Qwen 7B instruct result is the extreme case: 0% re-prompt success in this prompt set and protocol.
The re-prompt data does not support a clean “invitation scales” narrative. Re-prompt works on some models and fails on others, with no consistent scaling pattern. The contrast may reflect differences in conditioning, prompt interpretation, or perturbability. The behavioral results alone cannot distinguish reasoning from pattern matching or establish that safety in one regime comes from understanding.
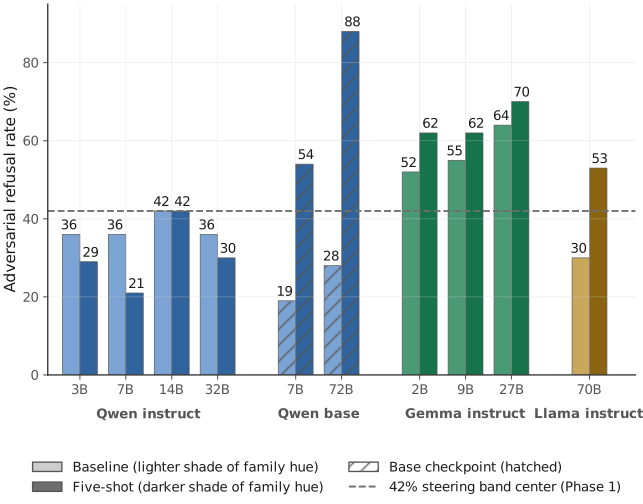
Figure 17b.3: Grouped bar chart comparing baseline refusal (the left bar in each pair) with five-shot refusal (the right bar) across four model groups. The dashed line marks the descriptive 42% steering cluster. Qwen instruct (3B, 7B, 14B, 32B): five-shot produces negative or neutral lift. Qwen base (7B, 72B): large positive lift, with 72B base reaching 88%. Gemma instruct (2B, 9B, 27B): modest positive lift. Llama 70B: strong positive lift from 30% to 53%. The figure reports behavioral response to examples; it does not identify the underlying cognitive mechanism.
Changing the Weights Reaches Further
Activation steering operates at inference time: it pushes the model’s residual stream without changing any weights. The natural question is whether modifying the weights directly reaches further. The CSF programme then tested this with LoRA (Low-Rank Adaptation) fine-tuning, which adjusts a small set of added weights rather than the whole model, across three scales of the Qwen Instruct family.
| Model | Baseline | N=10 | N=50 | N=100 | Best |
|---|---|---|---|---|---|
| 7B | 36% | 43% (+7) | 56% (+20) | 52% (+16) | 56% |
| 14B | 42% | 49% (+7) | 53% (+11) | 58% (+16) | 58% |
| 72B | 32% | 35% (+3) | 42% (+10) | 47% (+15) | 47% |
All three models exceeded the descriptive 42% cluster under at least one LoRA condition. LoRA reached higher refusal rates than lean-grid activation steering at 7B and 14B. At 72B, its 47% result is below the companion sweep’s normalized 49%; these differently selected protocols establish no general ordering of training-time and inference-time control. The experiment did not localize the mechanism. No over-refusal was detected on the programme’s fifty benign prompts for any LoRA condition.
Whether scale seems to matter depends on the dose. Ten training examples produce a seven-percentage-point lift at 7B, seven points at 14B, and three points at 72B. At N=100, the lifts are nearly equal: sixteen points at 7B, sixteen at 14B, and fifteen at 72B. The larger model ends at a lower absolute refusal rate because it begins lower. These three scale points do not support a general claim that training-time returns diminish with scale.
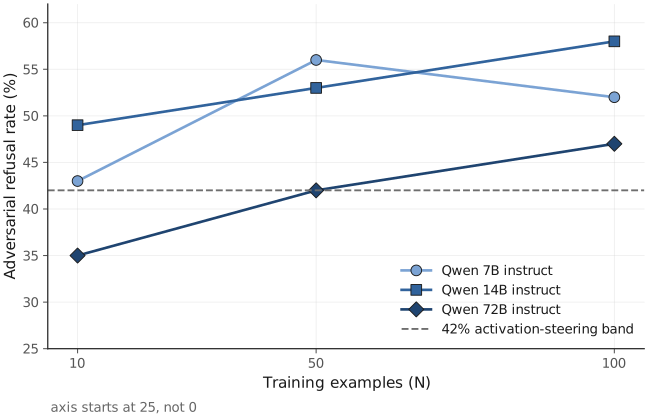
Figure 17b.4: LoRA dose-response plotted for three Qwen Instruct models. X-axis: number of training examples (10, 50, 100). Y-axis: adversarial refusal rate (25% to 60%). The 7B line (circle markers) peaks at 56% with 50 examples, then falls to 52% at 100. The 14B line (square markers) reaches 58% with 100 examples. The 72B line (diamond markers) reaches 47% with 100 examples. A horizontal dashed line marks the observed 42% activation-steering cluster. At N = 100, the lifts over baseline are 16, 16, and 15 percentage points.
The contrast with the 72B base model is suggestive but confounded. Five-shot prompting reached 88% refusal on the base model, while LoRA fine-tuning with 100 examples reached 47% on the instruction-tuned model. Both intervention type and model training change across that comparison. Five-shot on the 72B instruct model and LoRA on the 72B base model were not run, so this is not an intervention-only contrast.
What This Means for the Trust Attractor
The CSF programme supplies a bounded result: a direction that separates refusal from compliance in-sample may have little causal leverage when injected during generation. Prompt-level examples and re-prompts behave differently across model families and training regimes, while LoRA moves these instruction-tuned Qwen models beyond the descriptive 42% cluster. At 72B, the normalized companion steering rate remains higher than the reported LoRA rate.
The programme does not establish a universal scale threshold, a thermodynamic fixed point, or a clean opposition between conditioning and reasoning. Qwen conversion is non-monotonic, Llama 70B is a coherence failure, Gemma and Llama provide too few scale points for a scaling law, and the five-shot mechanism is unidentified. The Qwen 72B instruct and Llama 8B points also come from companion sweeps rather than the lean grid used for the other principal points.
Within those limits, the findings provide partial support for a narrower Trust Attractor prediction: control surfaces that look legible to an observer need not remain effective levers, and relational or prompt-level interventions cannot be assumed to scale uniformly either. A decisive test would use matched base and instruction-tuned checkpoints (same pretraining, differing only in post-training), direction evaluation on prompts unseen during fitting, filters that discard incoherent output before scoring, and the same intervention suite at every scale.
Author’s unpublished programme, CSF-1 through CSF-5 (2026), with per-condition checkpointing, N = 100 adversarial and 50 benign prompts per condition, and pre-registered predictions scored blind before results were examined. Two instruct data points come from companion sweeps rather than the CSF lean grid: Qwen 72B instruct (the CAST-72B direction sweep) and Llama 8B (the B3 rescue). The other eight instruct models and both base models use the lean grid. The full per-model breakdown, methodology, and pre-registration scoring appear in the validation chapter (Chapter 17e). Analysis code in the online companion.↩︎
The three R2 values in this paragraph come from different samples, and one fits a different quantity, so they cannot be compared to one another. All three are recomputable from the analysis output in the online companion. The 0.14 is a log-linear fit of the separability-behavior gap (AUROC minus best-steered refusal rate) against log parameter count over all thirteen conditions in that file: the ten grid conditions, both base checkpoints included, plus three companion points (an earlier 7B run with unmatched methodology, the CAST-72B sweep, and a reconstructed Llama 8B point). The 0.395 is the same log-linear gap fit restricted to the four Qwen instruct grid points (3, 7, 14, and 32 billion; gaps 0.56 to 0.63), the sample scored as prediction P3 in the pre-registration scorecard, and the only sample on which the analysis reproduces 0.395. The 0.995 is a logistic fit of conversion rate, a different quantity from the gap, to that same four-point Qwen instruct series; it excludes the 72 billion rebound point, which no logistic fit accommodates, and at four points a three-parameter curve reaches near-perfect R2 almost trivially, so the value carries little evidential weight.↩︎
This galley is still changing. To hear when chapters are revised or the book is published, subscribe on Substack.